Summary
For the latter half of 2019 and January 2020, I managed an initiative at Clark Construction to improve daily manpower reporting on construction sites. The focus of the team was to:
- Increase the percentage of daily reports received
- Increase the number of reports approved by project members
- Tie work completed to schedule activities, enabling real-time progress tracking
To meet these goals, I helped create a web app to allow efficient data input and review. I helped wireframe new concepts and metrics, and tested beta versions weekly before they were released to our pilot project team. Based on our initial findings, nearly 100% of reports were being submitted compared to a previous standard of less than 10%. This gave the team confidence that the app would be adopted easily in the field.
To track progress on our goals, I learned and used mySQL to create five KPIs measuring daily report submission and review. This was displayed on the app’s home page so that internal team members could understand where there was room for improvement on the project.
After our pilot period, my team presented our progress to C-suite executives. The presentation was received well and the team was given a green light to start the next phase of development and roll out.
Project Context and Goals
The goals of the Manpower App project were to:
- Increase the percentage of daily reports received
- Increase the number of reports approved by project members
- Tie work completed to schedule activities, enabling real-time progress tracking
To enable these goals, my team developed an easy system to track the following:
- The number of people on site each day
- The productivity of each crew
- The progress of each schedule activity
- The timeliness and accuracy of daily reports
- The percent of daily reports reviewed and verified by construction management team
Tracking manpower and progress on schedule takes a significant amount of a construction manager’s time. Typically this is done by manual surveys or estimates. Having an automated way to track progress can lead to more efficient review of contractor performance and billing, as well as a better way to document progress for monthly reports. Our team estimated that the proposed manpower app could lead to a 50% decrease in time spent progress tracking.
This project also made headway on subcontractor daily report compliance. Each contractor must complete a daily report each work day listing out what work was completed and how many people were on the project that day. In the past, this was all done on paper and paperwork could easily be lost or misplaced. With the new digital system, the team would be able to easily see all reports without fear of losing them. Keeping these records is vital, especially in case of an audit or lawsuit. If a trade contractor or other party has a dispute about the project work, teams use daily reports to piece together what was actually occurring each day.
To this end, it is important for project teams to actually read daily reports. If a contractor is falsifying information to build up a claim for a future lawsuit, the team needs to catch this and make sure only accurate information is written and saved. As such, another key goal of this project was to create a module to allow the construction management team to review and approve/reject daily reports. This module allowed a team to see which reports were submitted, which required approval, and which had been rejected.
With these goals in mind, our team led app development and beta testing to turn the above goals into a company wide standard reporting system. We hoped that the new method would yield higher daily report compliance and review, which in turn would lead to decreased time spent manually entering report information and increased assurance that project records were safely stored for auditing and legal purposes.
Work Performed
Product Management Role
In tandem with a co-worker, I created the frameworks for the visuals and reporting features in the application.
The application had several main components:
- Home Dashboard
- Daily report input module
- Daily report review summary module
- Daily report review detail module
The app was developed by a web development contractor, using pug.js language. My colleague and I oversaw the developer by leading weekly demo sessions, creating and updating a product backlog, and testing the weekly product for accuracy. Testing was done by our R&D team in conjunction with a pilot project. I also helped oversee budgeting, invoicing, and development of a Phase II product backlog/scope for the project.
Below, I will provide an overview of the work done on each of the app components.
Home Dashboard
On the home page of the web app, there are links to the other app modules and a snippet of the day’s schedule.
Additionally, five app KPIs are displayed for the construction team to view. These KPIs measure daily report and review timeliness, and I created them by querying the app database via mySQL and SQL Server Management Studio.
Daily Report Input Module
As part of the project, I designed a user-friendly interface that allowed end users to easily input daily report data. Without user support and input, the app would not be effective, would not meet organizational goals, and would not yield any data to analyze.
This module consisted of several parts:
- Upcoming schedule activities scrolldown section
- Table to input crew numbers, hours worked, and task ID of the work performed
My work on this module consisted of optimizing a wire frame of the input table. I collaborated with our pilot project team and contractors to monitor how well previous versions of the software were received. After gathering user input, I came up with new layouts and input methods to help ensure quick adoption of this app. These layouts were relayed to our software developer during weekly meetings, and timelines for mockups and final implementation were determined.
Daily Report Review Timelapse Module
The remaining portions of our manpower app focused on optimizing our staff’s review of daily reports.
At the “bird’s eye” level, I wireframed a table displayed approval status and summary manpower values. A mockup of this table is shown below. Each column represents a date, and each row represents the manpower of a given subcontractor per day. If a subcontractor submits a report, that day’s cell turns green for that contractor. If a subcontractor is supposed to be working but did not submit a report their cell will appear red. A cell appears white if no workers are needed that day. At the top, there is a green check mark or red ‘X’. If a project team has completed all inspections, the check mark will appear. If not, an X will appear and indicate that the team needs to review information from that day.
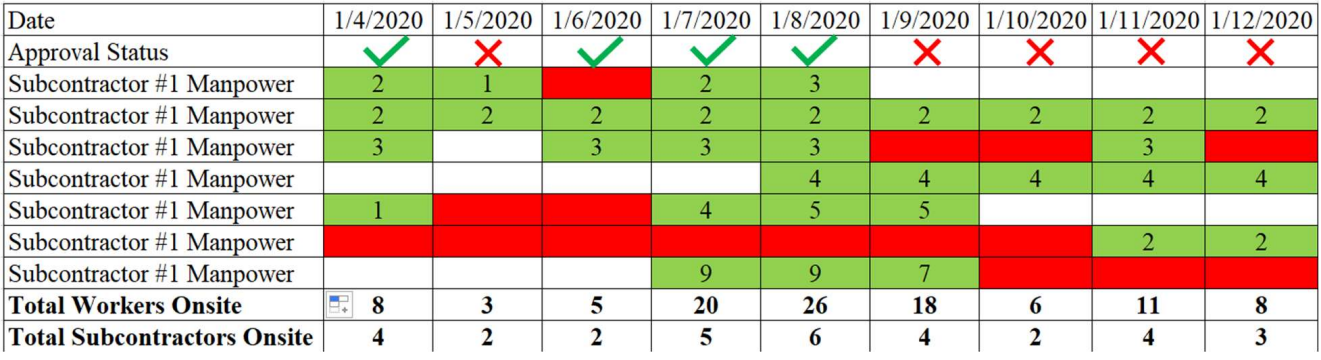
The table allows project managers to view manpower trends on a project for any date range at a glance, a feature not available on previously used software. With these trends, project managers can now more easily do the following:
- Determine which subcontractors are scheduled to be on site, and why scheduled contractors are not on site. This helps managers determine whether a project is on-time, and create mitigation plans as needed to recover any lost time.
- Contact subcontractors to inquire about insufficient manpower. Having a concise table of manpower allows project managers to quickly determine whether any subcontractors have critically low manpower that could slow down progress.
- Estimate total hours worked on the project for safety record reporting. Prior to the creation of this table, managers could spend hours or days performing similar estimates and paperwork for mandated records.
- Determine which daily reports are not approved, and ensure reports subsequently get approved. Without approval, executive leadership can’t be sure of the report’s accuracy.
Daily Report Review Summary Module
After looking at the high-level summary data for a given date range, the team could drill down and look at one specific day’s data in the Summary module. This module that my I helped create was designed to clean up subcontractor-input data. It allowed staff to view submitted data, edit as needed to ensure accuracy, re-send to the contractor for correction, and approve the final report submissions. Without this feature, inaccurate data could be used in final analytics and skew manpower metrics.
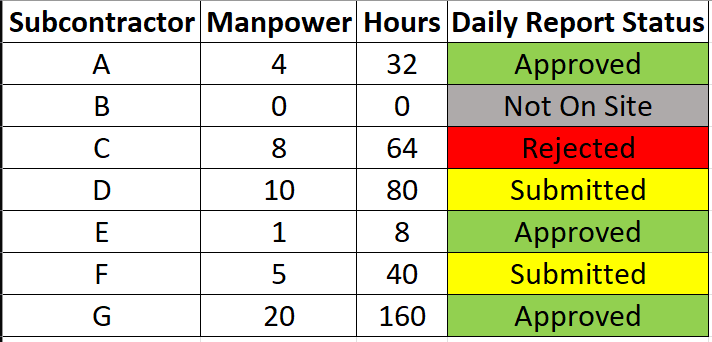
I helped design the structure of this module. To the team, it appeared as a table. A list of subcontractors that were supposed to be on site appeared in the far left column, and a summary of workers on site, hours worked, and daily report status were displayed.
This module allowed our project field team to quickly assess the manpower on site, and know which contractors they had to follow up with to complete their reports. Ensuring that all subcontractors filled out daily reports was critical to project reporting. Typical projects had less than 10% compliance, but our pilot project indicated a near 100% completion rate which indicated that our team’s re-design appeared to improve compliance by a significant amount.
The end table had similar structure to the below Excel mockup:
Daily Report Detail Module
The last module in the app was the daily report detail module. This part of the app allowed managers to click into individual contractor daily reports. It would show a break down of how many crew member’s were assigned to which task and the total hours they worked. The managers could compare this to what they saw while observing the project and talking with foreman to determine whether there were any omissions or inaccuracies. If an entry was inaccurate, the manager could discuss with the appropriate contractor to resolve the issue. Once the daily report was deemed satisfactory, the manager would approve the report. Report approval was a key goal of the app, because it would signal that our company agreed with all activities and comments shown on the daily report. Any mistakes or omissions from un-reviewed or inaccurate reporting could lead to legal ramifications for the company.
SQL KPI Development
With the basic app modules set up, I then turned my attention to creating KPIs to measure project performance. We wanted the project teams to know how contractors and project staff members were doing, so that performance could be optimized and recognized within the company.
Ultimately, these KPIS would also allow executive leadership to determine whether the app was successful as a whole and monitor individual project performance. If not successful, the project could be cut after the pilot phase.
I developed 5 metrics as part of this process. These metrics were as follows:
- Accuracy - measures whether subcontractors are submitting accurate reports, judged by determining whether construction management personnel have edited/rejected any of the information submitted by subs. This is critical because if our team has to edit many entries, then we are not saving as much time as anticipated by using the new system.
- Compliance - measures the number of subcontractors that are submitting reports, as a percentage of subs that are expected to be working. If contractors are not using the new app, then the time spent developing it may have been wasted and it may not be worth the company’s time and money to maintain and build out the app.
- Timeliness - measures the percentage of subcontractors that submit a daily report within 48 hours of the day activities took place. As time goes on, foremen are more likely to forget the details of what happened on previous days and having this statistic can help teams ensure reports are submitted on time and are hopefully more comprehensive as a result.
- Timely Compliance - measure combines #2 and #3. This helps teams determine the number of subs submitting on time as a percentage of how many total reports they are expecting. This is a more complete measure of compliance.
- Validation - measures the percent of reports the Clark team has approved. If reports are not approved, they also have likely not been reviewed by Clark. This is critical because if Clark is not validating daily submissions, then inaccurate or incomplete daily reports may not be check.
I developed all the above metrics via mySQL queries. To do this, I took initiative to learn SQL online and understand the structure of the project’s databases.
With this knowledge I then used a series of SQL queries to filter and aggregate the data. In particular, I had to use a series of self joins to create a chart of the above metrics over time. With relatively little help from my supervisor, I was able to create these metrics quickly and incorporate them into the web app for project teams and executives to view.
Final Presentation
At the end of our pilot phase, I helped present our project project to C-suite executives and project executives. After a half hour presentation detailing our approach, new modules, and tentative KPI values our team was given the proceed to continue building new features and begin planning rollout company-wide.
Conclusion
To better track manpower on our project teams, I helped manage the development of a custom manpower app as part of an internal R&D team.
The apps goals were to:
- Increase the percentage of daily reports received
- Increase the number of reports approved by project members
- Tie work completed to schedule activities, enabling real-time progress tracking
To meet these goals, I helped create a web app to allow efficient data input and review by on site team members. I helped wireframe new concepts and metrics, and tested beta versions weekly before they were released to our pilot project team. Based on our initial findings, nearly 100% of reports were being submitted compared to a previous standard of less than 10%. This gave the team confidence that the app would be adopted easily in the field.
To track progress on our goals, I learned and used mySQL to create five KPIs measuring daily report submission and review. This was displayed on the app’s home page so that internal team members could understand where there was room for improvement on the project.
After our pilot period, my team presented our progress to C-suite executives. The presentation was received well and the team was given a green light to start the next phase of development and roll out.